Hello! I’m Alex, the creator of Diagrams’ app icon. While working on refining the UI and UX of the application, I’d like to share a few bits from the logo and app icon design process.
Logo
The logo itself was designed by Knick Design, a design agency based in Leipzig, Germany. They did a great job creating an interesting and unique symbol which eventually became the main part of the logo.
But of course, every design has to go through a long process with many changes. It’s impossible to find the right design in just one sketch or idea. Lukáš and the design team worked on a lot of different variations. Some of the early ideas included elements like whiteboards, light bulbs, and diagram objects.

In such a design process, you typically start with basic ideas and elaborate on them taking various directions before you find something that works. You come up with more crazy ideas along the way and continue to create different versions until you eventually find that one interesting draft that everyone can agree on.
We aimed to make a logo which reflects our vision and the core features like creating structures. It also had to be easy to recognize. In the end, the idea of an ant was chosen. You may ask, “What does an ant have to do with a diagramming application”?
Ants are very structured, systematic and architectural animals. That’s exactly what Diagrams aims to be! Using an ant as a logo differentiates us greatly from other diagramming applications. Most of them use some kind of diagram objects in their logos and app icons which all look very similar to each other.

The animal metaphor wasn’t enough, though. The idea was to visually link the logo to what our application does – creating diagrams. That’s why the ant head is built out of parts which can be found in the application. The head shape represents an element, the antennae represent relationships, and the eyes represent connection points.
A remarkable and unique logo was born! But what about the app icon that sits in the dock of every user?
App Icon
As mentioned at the beginning, I came into play for this specific phase. My task was to create an icon for the Mac application which respects the platform and is based on the logo in some way.
Why don’t we just use the logo as it is for the icon? Mac apps always have a certain visual look that gives the icon depth and materiality. Adopting this look makes the app feel at home on macOS and also shows that we care about this platform. Being able to stand out is a challenge. I always aim to be unique while blending in with the platform when designing app icons!
I started by creating drafts of the icon which could be divided into two categories. The first category was built around the ant head symbol from the logo and the second category depicted the app’s capabilities in a more direct way. The result can be found in this sketch:

It’s common for icons to represent the purpose of applications in direct ways. For example, Keynote shows a presentation desk where you will stand when presenting your slides and Mail shows a postage stamp as a symbol for sending electronic mails. Inspired by this approach we decided to elaborate on the concept of a whiteboard with a marker and I created more drafts.
Although this icon would perfectly represent what Diagrams does; it felt too clunky and noisy to us. But more importantly, it lost all the uniqueness which was put into the logo. And so we went back to the drafts with the ant head and decided to try a 3D representation. I’ve modeled the ant head in a 3D program and placed it on a variety of rectangular backgrounds. We quickly settled on the icon with the paper stack in the background.
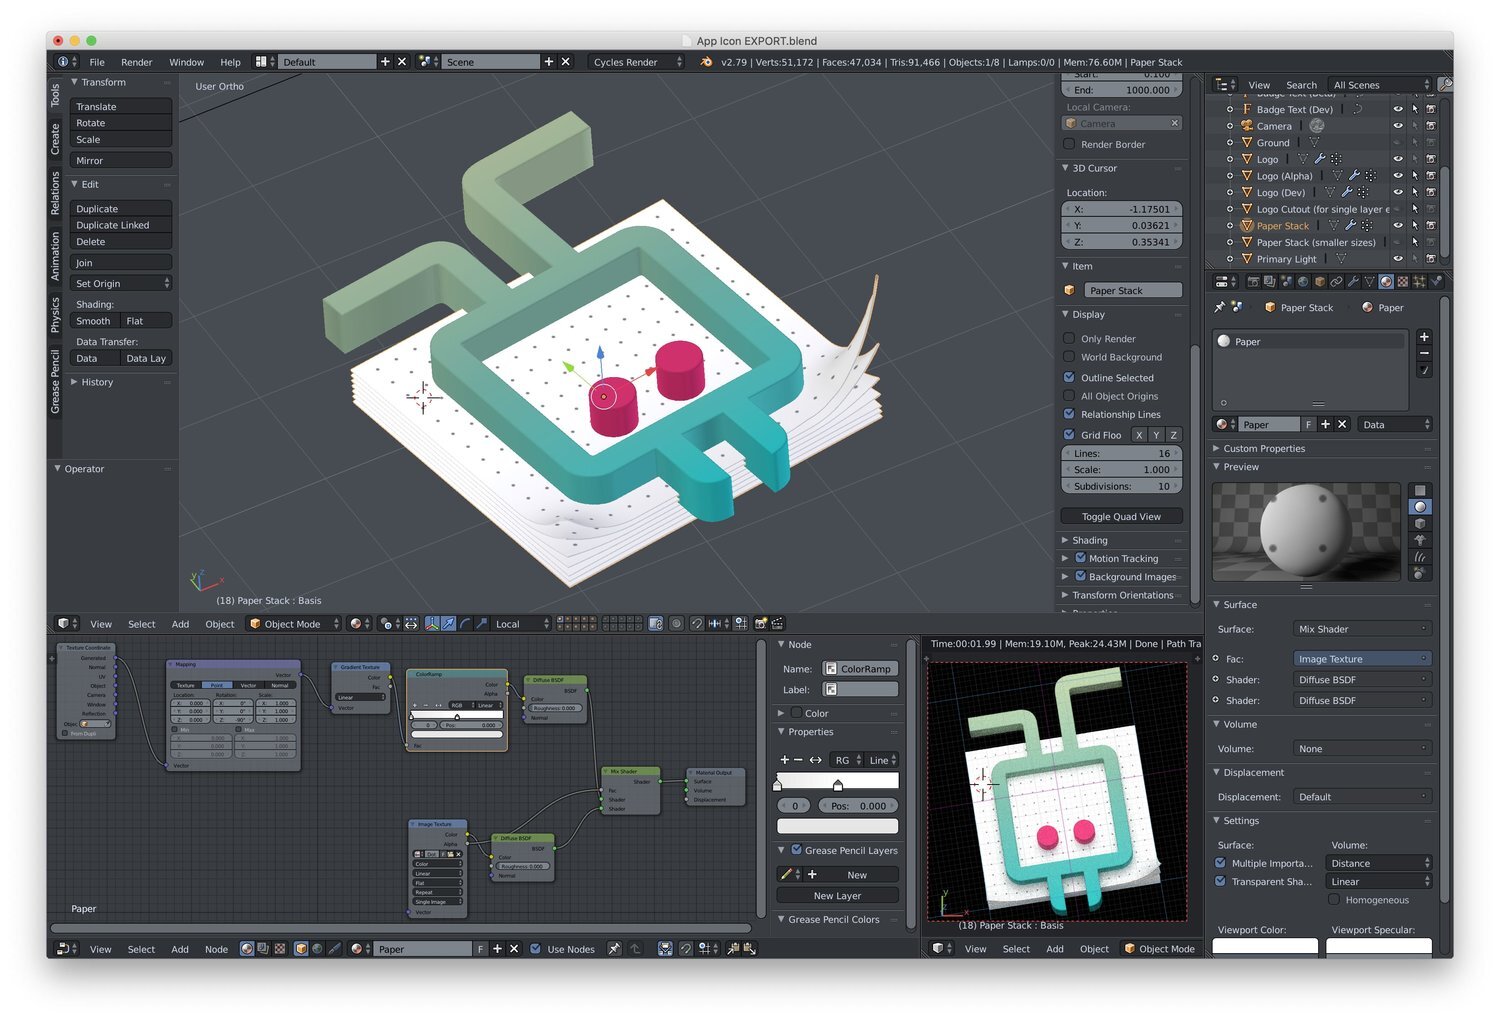
Creating the icon in a 3D program was kind of new to me, as I usually work with vector drawing tools. In this case, it made sense to create everything in 3D as we were able to tweak the perspective, material, and light in the most realistic way. For example, the page curl of the paper stack looks just the way I wanted it to look, seen from the final perspective, but it looks stretched from other angles as you can see in the screenshot. Sometimes you have to push the limits in order to come up with a good-looking icon.
This is the final icon you will soon see in your Dock. It looks very clean and doesn’t have many details which make it easily recognizable even in smaller sizes. Its unique shape makes it stand out among other icons as more and more Mac icons are flat and wrapped in circles these days.
For internal use, I also created a few alternate variants to distinguish between the release, beta, alpha, and development versions of the application. They are too cool to just use them behind closed doors. Enjoy this bit of trivia.
At Diagrams, we currently see the red alpha icon on our Macs. Soon we’ll step up to the beta for the first time. Do you want to help us with testing and polishing the app for the final release? Feel free to subscribe to our mailing list and we’ll let you know when the public beta will arrive.
Thanks for reading this in-depth look. We hope you like the logo and the app icon.
See you later,
Alex


